Note
Click here to download the full example code
Visualize and compare model results
Visualize model results and compare to other model results or reference data.
from __future__ import annotations

import logging

from gemseo.datasets.dataset import Dataset
from gemseo.post.dataset.bars import BarPlot
from gemseo.post.dataset.scatter_plot_matrix import ScatterMatrix
from numpy import atleast_1d
from pandas import DataFrame
from pandas import concat

from vimseo import EXAMPLE_RUNS_DIR
from vimseo.api import activate_logger
from vimseo.api import create_model
from vimseo.core.model_result import ModelResult
from vimseo.core.model_settings import IntegratedModelSettings
from vimseo.utilities.plotting_utils import plot_curves

activate_logger(level=logging.INFO)
After execution, the results of a model can be visualized. The curves are shown by default:
model_name = "BendingTestAnalytical"
load_case = "Cantilever"
model = create_model(
    model_name,
    load_case,
    model_options=IntegratedModelSettings(
        directory_archive_root=EXAMPLE_RUNS_DIR / "archive/visualize_model_result",
        directory_scratch_root=EXAMPLE_RUNS_DIR / "scratch/visualize_model_result",
        cache_file_path=EXAMPLE_RUNS_DIR
        / f"caches/visualize_model_result/{model_name}_{load_case}_cache.hdf",
    ),
)
model.cache = None
model.archive_manager._accept_overwrite_job_dir = True
model.execute()
result = ModelResult.from_data({
    "inputs": model.get_input_data(),
    "outputs": model.get_output_data(),
})
figs = model.plot_results(show=True, save=False)
figs["dplt_vs_dplt_grid"]
Out:
    INFO - 19:44:39: Current root directory of job directory is C:\Users\sebastien.bocquet\Dev\vimseo\docs\runnable_examples\model_runs\archive\visualize_model_result.
    INFO - 19:44:40: Found 1 entries in the cache file : BendingTestAnalytical_Cantilever_cache.hdf node : node
    INFO - 19:44:40: Saving plots to C:\Users\sebastien.bocquet\Dev\vimseo\docs\runnable_examples\02_integrated_models
    INFO - 19:44:40: Plot BendingTestAnalytical_Cantilever_dplt_vs_dplt_grid.html is saved to C:\Users\sebastien.bocquet\Dev\vimseo\docs\runnable_examples\02_integrated_models\BendingTestAnalytical_Cantilever_dplt_vs_dplt_grid.html
    INFO - 19:44:40: Plot BendingTestAnalytical_Cantilever_moment_vs_moment_grid.html is saved to C:\Users\sebastien.bocquet\Dev\vimseo\docs\runnable_examples\02_integrated_models\BendingTestAnalytical_Cantilever_moment_vs_moment_grid.html
figs["moment_vs_moment_grid"]
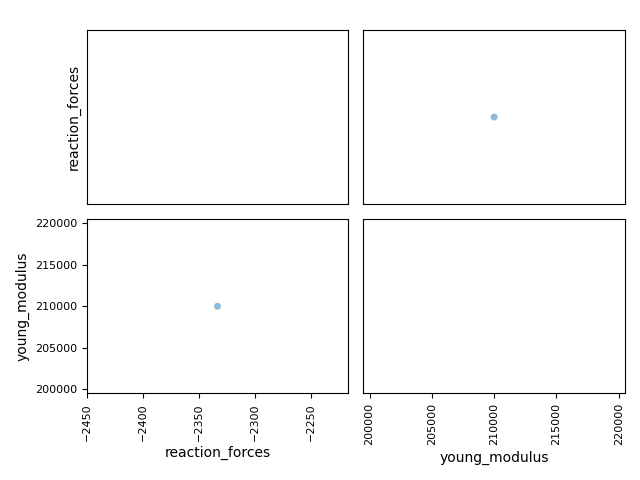
Scalar outputs can be visualized in a scatter matrix:
figs = model.plot_results(
    show=True,
    save=True,
    data="SCALARS",
    scalar_names=["young_modulus", "reaction_forces"],
)
figs["scalars"]
Out:
    INFO - 19:44:40: Saving plots to C:\Users\sebastien.bocquet\Dev\vimseo\docs\runnable_examples\02_integrated_models
C:\Users\sebastien.bocquet\Dev\vimseo\.tox\doc\Lib\site-packages\pandas\plotting\_matplotlib\misc.py:91: UserWarning:

Attempting to set identical low and high xlims makes transformation singular; automatically expanding.

C:\Users\sebastien.bocquet\Dev\vimseo\.tox\doc\Lib\site-packages\pandas\plotting\_matplotlib\misc.py:100: UserWarning:

Attempting to set identical low and high xlims makes transformation singular; automatically expanding.

C:\Users\sebastien.bocquet\Dev\vimseo\.tox\doc\Lib\site-packages\pandas\plotting\_matplotlib\misc.py:101: UserWarning:

Attempting to set identical low and high ylims makes transformation singular; automatically expanding.

C:\Users\sebastien.bocquet\Dev\vimseo\.tox\doc\Lib\site-packages\gemseo\utils\matplotlib_figure.py:59: UserWarning:

FigureCanvasAgg is non-interactive, and thus cannot be shown


[<Figure size 640x480 with 4 Axes>]
Results can be obtained by querying the archive.
For a DirectoryArchive, the path to access to the current result is:
model.archive_manager.job_directory
Out:
WindowsPath('C:/Users/sebastien.bocquet/Dev/vimseo/docs/runnable_examples/model_runs/archive/visualize_model_result/BendingTestAnalytical/Cantilever/7')
A result can be retrieved from this path:
result = ModelResult.from_data(
    model.archive_manager.get_result(model.archive_manager.job_directory)
)
print(result)
Out:
    INFO - 19:44:41: Found 1 entries in the cache file : BendingTestAnalytical_Cantilever_cache.hdf node : node

Scalars:
{'young_modulus': 210000.0, 'nu_p': 0.3, 'length': 600.0, 'width': 30.0, 'height': 40.0, 'imposed_dplt': -5.0, 'relative_dplt_location': 1.0, 'reaction_forces': -2333.3333333333335, 'dplt_at_force_location': -5.000000000000006, 'maximum_dplt': -5.000000000000006, 'location_max_dplt': 600.0}

Vectors:
{}

Curves:
   ('dplt_grid', 'dplt')
               0         1          2          3          4          5          6          7          8          9          10         11         12         13         14         15         16          17          18          19          20          21          22          23          24          25          26          27          28          29          30          31          32          33          34          35          36          37         38          39          40          41          42          43          44          45          46          47          48          49          50          51          52          53          54          55          56          57          58          59          60          61          62          63          64          65          66          67          68          69          70          71          72          73          74          75          76          77          78          79          80          81          82          83          84          85          86          87          88          89          90          91          92          93          94          95          96          97          98     99
dplt_grid  0.0  6.060606  12.121212  18.181818  24.242424  30.303030  36.363636  42.424242  48.484848  54.545455  60.606061  66.666667  72.727273  78.787879  84.848485  90.909091  96.969697  103.030303  109.090909  115.151515  121.212121  127.272727  133.333333  139.393939  145.454545  151.515152  157.575758  163.636364  169.696970  175.757576  181.818182  187.878788  193.939394  200.000000  206.060606  212.121212  218.181818  224.242424  230.30303  236.363636  242.424242  248.484848  254.545455  260.606061  266.666667  272.727273  278.787879  284.848485  290.909091  296.969697  303.030303  309.090909  315.151515  321.212121  327.272727  333.333333  339.393939  345.454545  351.515152  357.575758  363.636364  369.696970  375.757576  381.818182  387.878788  393.939394  400.000000  406.060606  412.121212  418.181818  424.242424  430.303030  436.363636  442.424242  448.484848  454.545455  460.606061  466.666667  472.727273  478.787879  484.848485  490.909091  496.969697  503.030303  509.090909  515.151515  521.212121  527.272727  533.333333  539.393939  545.454545  551.515152  557.575758  563.636364  569.696970  575.757576  581.818182  587.878788  593.939394  600.0
dplt       0.0 -0.000763  -0.003040  -0.006817  -0.012079  -0.018809  -0.026992  -0.036612  -0.047655  -0.060105  -0.073946  -0.089163  -0.105741  -0.123663  -0.142915  -0.163481  -0.185345   -0.208492   -0.232908   -0.258575   -0.285479   -0.313604   -0.342936   -0.373457   -0.405153   -0.438009   -0.472009   -0.507137   -0.543379   -0.580718   -0.619139   -0.658627   -0.699166   -0.740741   -0.783336   -0.826936   -0.871525   -0.917088   -0.96361   -1.011075   -1.059467   -1.108772   -1.158973   -1.210055   -1.262003   -1.314801   -1.368434   -1.422886   -1.478142   -1.534187   -1.591004   -1.648579   -1.706897   -1.765940   -1.825695   -1.886145   -1.947276   -2.009071   -2.071516   -2.134595   -2.198291   -2.262591   -2.327478   -2.392938   -2.458953   -2.525510   -2.592593   -2.660185   -2.728272   -2.796839   -2.865869   -2.935348   -3.005259   -3.075588   -3.146319   -3.217436   -3.288924   -3.360768   -3.432952   -3.505461   -3.578278   -3.651390   -3.724780   -3.798432   -3.872332   -3.946464   -4.020812   -4.095361   -4.170096   -4.245001   -4.320060   -4.395259   -4.470581   -4.546011   -4.621534   -4.697135   -4.772797   -4.848505   -4.924245   -5.0

   ('moment_grid', 'moment')
                        0      1
moment_grid        0.0  600.0
moment       1400000.0    0.0

Fields:
{}
Two model results can be compared. We first generate a second result:
model.execute({"young_modulus": atleast_1d(1.95e5), "imposed_dplt": atleast_1d(-10.0)})
result_1 = ModelResult.from_data({
    "inputs": model.get_input_data(),
    "outputs": model.get_output_data(),
})
result_1
Out:
    INFO - 19:44:41: Current root directory of job directory is C:\Users\sebastien.bocquet\Dev\vimseo\docs\runnable_examples\model_runs\archive\visualize_model_result.
    INFO - 19:44:41: Found 1 entries in the cache file : BendingTestAnalytical_Cantilever_cache.hdf node : node

ModelResult(metadata=ToolResultMetadata(generic={'datetime': '16-06-2026_19-44-41', 'version': '0.1.7.dev4+g13b1eb78b.d20260616'}, misc={}, settings={}, report={<MetaDataNames.model: 'model'>: 'BendingTestAnalytical', <MetaDataNames.load_case: 'load_case'>: 'Cantilever', <MetaDataNames.error_code: 'error_code'>: 0, <MetaDataNames.description: 'description'>: '', <MetaDataNames.job_name: 'job_name'>: '', <MetaDataNames.persistent_result_files: 'persistent_result_files'>: '', <MetaDataNames.n_cpus: 'n_cpus'>: 1, <MetaDataNames.date: 'date'>: '2026-06-16 19:44:41.398889', <MetaDataNames.cpu_time: 'cpu_time'>: 0.0060427188873291016, <MetaDataNames.user: 'user'>: 'sebastien.bocquet', <MetaDataNames.machine: 'machine'>: 'PCBM20250036', <MetaDataNames.vims_git_version: 'vims_git_version'>: '5cd5cf5ab4caf1fa2c2190f0396e06b5b5639fd0', <MetaDataNames.directory_archive_root: 'directory_archive_root'>: 'C:\\Users\\sebastien.bocquet\\Dev\\vimseo\\docs\\runnable_examples\\model_runs\\archive\\visualize_model_result', <MetaDataNames.directory_archive_job: 'directory_archive_job'>: 'C:\\Users\\sebastien.bocquet\\Dev\\vimseo\\docs\\runnable_examples\\model_runs\\archive\\visualize_model_result\\BendingTestAnalytical\\Cantilever\\8', <MetaDataNames.directory_scratch_root: 'directory_scratch_root'>: 'C:\\Users\\sebastien.bocquet\\Dev\\vimseo\\docs\\runnable_examples\\model_runs\\scratch\\visualize_model_result', <MetaDataNames.directory_scratch_job: 'directory_scratch_job'>: ''}, model=ModelDescription(name='BendingTestAnalytical', summary=' An analytical model for the bending of a parallelepipedic beam', load_case=Beam_Cantilever(name='Cantilever', domain='Beam', summary='A cantilever load case.', plot_parameters=PlotParameters(curves=[]), bc_variable_names=['imposed_dplt', 'relative_dplt_location'], load=Load(direction='', sign='', type='')), dataflow={'model_inputs': ['length', 'width', 'height', 'imposed_dplt', 'relative_dplt_location', 'young_modulus', 'nu_p'], 'model_outputs': ['reaction_forces', 'maximum_dplt', 'dplt_grid', 'location_max_dplt', 'dplt', 'moment', 'moment_grid', 'dplt_at_force_location', 'error_code', 'model', 'load_case', 'description', 'job_name', 'persistent_result_files', 'n_cpus', 'date', 'cpu_time', 'user', 'machine', 'vims_git_version', 'directory_archive_root', 'directory_archive_job', 'directory_scratch_root', 'directory_scratch_job'], 'PreBendingTestAnalytical_Cantilever': {'inputs': ['length', 'width', 'height', 'imposed_dplt', 'relative_dplt_location', 'young_modulus', 'nu_p'], 'outputs': ['imposed_dplt_location', 'quadratic_moment', 'reaction_forces', 'moment', 'moment_grid', 'solver', 'boundary']}, 'RunBendingTestAnalytical': {'inputs': ['imposed_dplt_location', 'quadratic_moment', 'reaction_forces', 'moment', 'moment_grid', 'solver', 'boundary', 'length', 'width', 'height', 'imposed_dplt', 'relative_dplt_location', 'young_modulus', 'nu_p'], 'outputs': ['dplt', 'dplt_grid', 'moment', 'moment_grid', 'imposed_dplt_location', 'reaction_forces']}, 'PostBendingTestAnalytical_Cantilever': {'inputs': ['dplt', 'dplt_grid', 'moment', 'moment_grid', 'imposed_dplt_location', 'reaction_forces'], 'outputs': ['reaction_forces', 'maximum_dplt', 'dplt_grid', 'location_max_dplt', 'dplt', 'moment', 'moment_grid', 'dplt_at_force_location', 'error_code']}, 'subroutine_names': []}, default_inputs={<InputGroupNames.NUMERICAL_VARS: 'numerical variables'>: {}, <InputGroupNames.BC_VARS: 'boundary conditions variables'>: {'imposed_dplt': [-5.0], 'relative_dplt_location': [1.0]}, <InputGroupNames.GEOMETRICAL_VARS: 'geometrical variables'>: {'length': [600.0], 'width': [30.0], 'height': [40.0]}, <InputGroupNames.MATERIAL_VARS: 'material variables'>: {'young_modulus': [210000.0], 'nu_p': [0.3]}}, curves=[('dplt_grid', 'dplt'), ('moment_grid', 'moment')], verbose=False)), scalars={'length': 600.0, 'width': 30.0, 'height': 40.0, 'imposed_dplt': -10.0, 'relative_dplt_location': 1.0, 'young_modulus': 195000.0, 'nu_p': 0.3, 'reaction_forces': -4333.333333333333, 'dplt_at_force_location': -9.999999999999998, 'maximum_dplt': -9.999999999999998, 'location_max_dplt': 600.0}, vectors={}, curves=[<vimseo.utilities.curves.Curve object at 0x0000021A31D86A50>, <vimseo.utilities.curves.Curve object at 0x0000021A31D86BD0>], fields={}, snapshots=[])
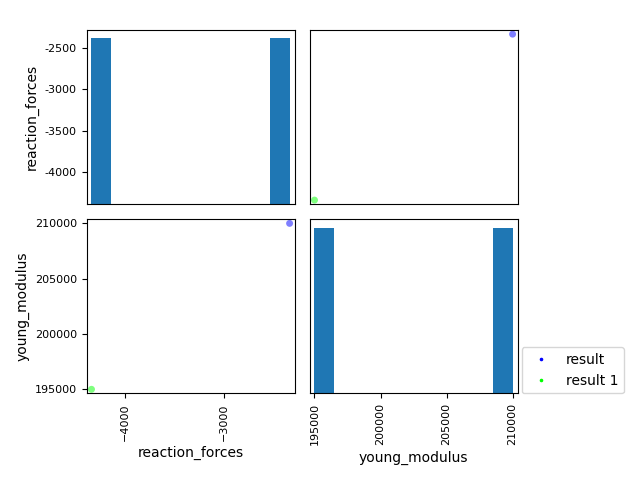
The scalars can be compared in a scatter matrix:
variable_names = ["young_modulus", "reaction_forces"]
df = DataFrame([
    result.get_numeric_scalars(variable_names=variable_names),
    result_1.get_numeric_scalars(variable_names=variable_names),
])
df["color"] = range(len(df))
plot = ScatterMatrix(Dataset.from_dataframe(df), coloring_variable="color")
plot.labels = ["result", "result 1"]
fig = plot.execute(
    save=False,
    show=True,
)
fig
Out:
C:\Users\sebastien.bocquet\Dev\vimseo\.tox\doc\Lib\site-packages\gemseo\utils\matplotlib_figure.py:59: UserWarning:

FigureCanvasAgg is non-interactive, and thus cannot be shown


[<Figure size 640x480 with 4 Axes>]
.. note::
Since the compared data are in a ``Pandas.DataFrame``,
other plotting library can be used, like ``Seaborn``:
``sns.pairplot(df)``
The curves can also be compared:
plot_curves(
    [
        result.get_curve(("dplt_grid", "dplt")),
        result_1.get_curve(("dplt_grid", "dplt")),
    ],
    labels=["result", "result 1"],
)
A model result can be compared to a data.
A synthetic data is generated as a Pandas.DataFrame:
df = DataFrame.from_dict({
    "young_modulus": atleast_1d(9e4),
    "nu_p": atleast_1d(0.25),
    "reaction_forces": atleast_1d(1e3),
})
variable_names = list(df.columns.values)
The model result is added to the DataFrame, and the latter is plotted:
df = concat(
    [
        df,
        DataFrame([result.get_numeric_scalars(variable_names=variable_names)]),
    ],
    ignore_index=True,
)
The dataframe is plotted to compare the model result to the synthetic result. First, we compare with a bar plot:
plot = BarPlot(Dataset.from_dataframe(df))
plot.title = "Comparison of model result with data"
plot.font_size = 20
plot.labels = ["data", "model result"]
fig = plot.execute(save=True, show=True, file_format="html")[0]
fig
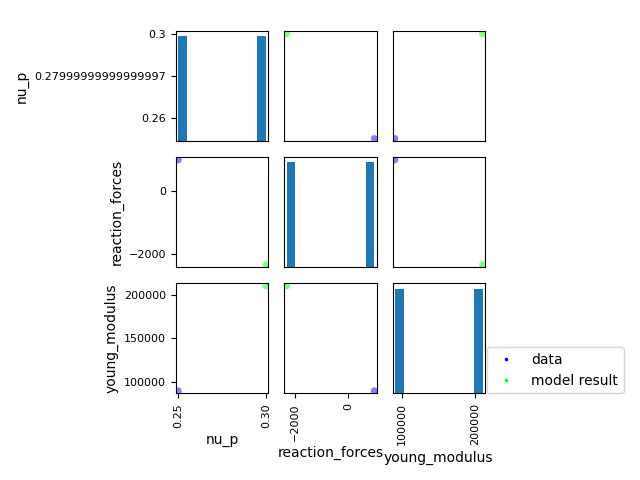
And with a scatter matrix. For a small number of data to compare (two here), it is less relevant than the bar plot, It may become more interesting for a larger number of data to compare:
df["color"] = range(len(df))
plot = ScatterMatrix(Dataset.from_dataframe(df), coloring_variable="color")
plot.labels = ["data", "model result"]
fig = plot.execute(
    save=False,
    show=True,
)
fig

Out:
C:\Users\sebastien.bocquet\Dev\vimseo\.tox\doc\Lib\site-packages\gemseo\utils\matplotlib_figure.py:59: UserWarning:

FigureCanvasAgg is non-interactive, and thus cannot be shown


[<Figure size 640x480 with 9 Axes>]
Total running time of the script: ( 0 minutes 3.942 seconds)
Download Python source code: plot_02_visualize-model_result.py
Download Jupyter notebook: plot_02_visualize-model_result.ipynb